Is it worth investing more money in your Network Interface Card?
Published September 12, 2018
The Proverb
The old saying goes that “You get what you pay for.” In an environment entrenched in industry standards, it is easy to simply state that if two pieces of hardware conform to the same standards, they must perform equally. With that mindset, why pay more for one piece of hardware over another? What justification might there be that warrants paying more for Brand X over Brand Y’s product? Certainly there are factors such as return policies, tech support, and warranties. But, can performance still play a part?
It remains a possibility that performance is still a viable reason for cost even when dealing within the realm of industry standards. It is possible that Network Interface Cards (NICs) may not perform equally despite being constrained to the network communications standards that ensure conformity and interoperability. While the unsuspecting consumer may look at other factors contributing to a product's cost, the performance of a NIC, even within the same classification of network protocols, has the potential to vary significantly.
This performance can vary not only from manufacturer to manufacturer, but also within the various chipsets offered by each manufacturer. Some chipsets are by design simply more efficient at dealing with their assigned network traffic compared to others. Their associated drivers also play a part in how efficiently the operating system deals with network card communications which only complicates the matters more.
Putting It To The Test
However, just telling you isn’t enough. Everyone wants proof. But, to test and examine the performance of all the available NICs on the market would be exhaustively time consuming and overall cost prohibitive. A slew of categories would need to be made to encompasses all the various network speeds (i.e. 10Mbps, 100Mbps, 1Gbps), connection media (i.e. twisted pair, single mode fiber), interface used (i.e. PIC, PCI-X, PCIe), and the operating system & drivers used (i.e. Windows 7, Windows Server 2012, Linux, FreeBSD, Solaris).
To vastly narrow the field, we looked at what is the most common in hardware so the field was narrowed to 1GbE PCIe NICs. But just narrowing the field of candidates down to 1GbE PCIe cards still leaves too many to possibly purchase and test them all. So, the field has to be further narrowed by focusing further on the different chipsets that power these cards.
While there are numerous manufacturers of NICs available on the market today, there are actually only a handful of chipset manufactures for them. There can certainly be variations from manufacturer to manufacturer in card construction, even using the same chipset. However, by and large, there is little variation in the construction surrounding a chip. This leads to a general lack of diversity.
Part of the problem with this lack of diversity stems from the fact that chipset manufacturers provide a suggested circuit configuration. This is not to say components can’t be of a higher quality than specified, or that engineers can’t modify or deviate from the suggested layout. However, few manufacturers actually deviate too far from the suggested plan.
To briefly show similarities between two separate manufacturers using the same chipset, examine the following four images. Notice that their chip, resistor, capacitor and crystal layouts are nearly identical. In fact, some card manufacturers actually produce their competitor’s equipment, which further compounds the problem. That leads to even fewer differences.
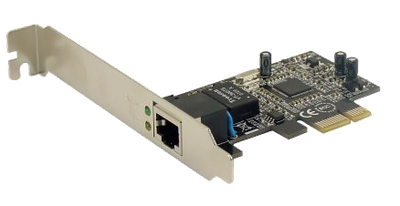
Sedna – SE-PCIE-LAN-GIGA w/ LSI chipset
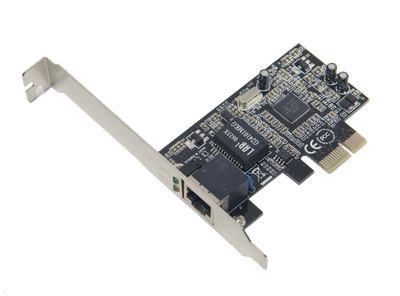
Syba – SD-PEX-GLAN w/ LSI chipset
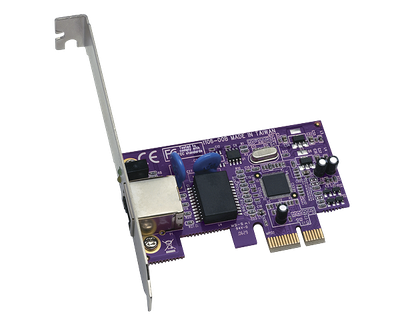
SoNNeT – GE1000LA-E w/ Marvell chipset
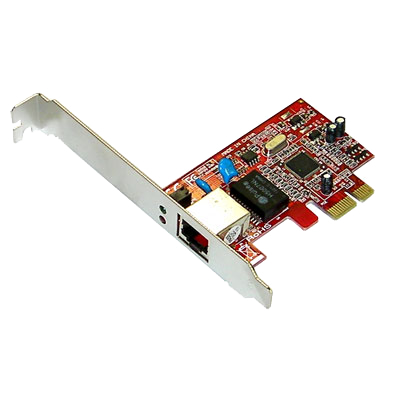
Masscool – XWT-LAN07 w/ Marvell chipset
So, assuming that the chip itself will more likely play a larger part in the overall performance, the next step is to identify chip manufacturers. Of the ones we found, some of the manufacturers are proprietary and only manufacture chips for their own cards. Several sell chips for other manufacturers to use in their own products. And, some only manufacture chips for onboard/motherboard use. For our test the chipset manufactures we chose were: Broadcom, Intel, LSI, Marvell, Realtek, Solarflare, and VIA.
The Equipment
Having identified the chipset manufactures, we quick searches on popular e-stores to round up some cards using these chipsets. While awaiting delivery, our next step was to devise some way to fairly test and judge them.
| Network Interface Cards | |||||
| NIC Manufacture | NIC Model | Chipset Manufacture | Chipset Model | List / MSRP | Purchase Price |
| Supermicro | X7DVL-E [Motherboard] | Intel | 82563EB | $345 | $80 |
| Syba | SY-PEX24003 | VIA | VT6130 | $13 | $10 |
| Syba | SD-PEX24009 | Realtek | RTL8111D | $13 | $12 |
| Netis | AD-1103 | Realtek | TRL8168B | $25 | $13 |
| Masscool | XWT-LAN07 | Marvell | 88E8053 | UNK | $15 |
| Syba | SD-PEX-GLAN | LSI | ET1310R | $33 | $19 |
| Sedna | SE-PCIE-LAN-1G-BCM | Broadcom | BCM5721 | $40 | $28 |
| Intel | EXPI9301CT | Intel | 82574L | $56 | $30 |
| Solarflare | SFN5122F | Solarflare | SFC9020 | $800 | $120 |
Two identical machines were built with the intent that the underlying hardware would not present any bottleneck in the test. Additionally, the OS needed to have minimal overhead yet provide both adequate driver support and a good testing environment. To that end, we loaded Ubuntu 13 onto two Supermicro servers with the following specs:
Test Systems |
|
|
Hardware |
|
|
Chassis |
Supermicro 811TQ-520B 1U Rackmount Server |
|
Motherboard |
Supermicro – X7DVL-E Dual Intel 64-bit Xeon Quad-Core w/ 1333MHz FSB, Intel 500V (Blackford VS) Chipset, 1 (x8) & 1 (x4) PCI-Express Slots |
|
CPU |
Intel Xeon E5450 (Harpertown) [x2] 12M Cache, 3.00 GHz, 1333 MHz FSB, LGA771, Quad-Core, 64-bit, 45nm, 80W |
|
RAM |
Memory Giant – 8GB [4x2GB] DDR-667, PC2-5300, FB-DIMM, CAS 5, voltage? |
|
Hard Drive |
Seagate Barracuda 7200.9 ST3120811AS 120GB HDD, 7200 RPM, 8 MB Cache, SATA-2 |
|
Power |
Supermicro PWS-521-1H 520W High-efficiency Power Supply |
|
Graphics |
ATI ES 1000 [Onboard] 16MB video memory |
|
Network Cable |
Cat6a USTP + fiber converter(s) |
|
Software and Drivers |
|
|
Operating System |
Ubuntu 13.10 Linux Kernel 3.11 |
|
BIOS |
Phoenix BIOS 7DVLC208 (Rev 2.1a) |
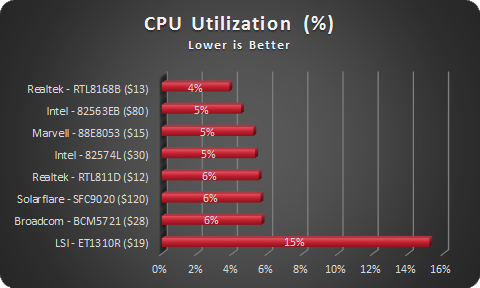
With the servers loaded and NICs in hand, the testing began. The first step was to establish a baseline. The Solarflare cards were brought in to establish that for us. Directly connected, iPerf3 was used to measure throughput and verify that neither the cards themselves or any of the underlying hardware or operating system would present a bottleneck. Hitting speeds of 7Gbps, and pushing the CPU utilization to only 40%, there was no question that the hardware would present minimal if any restrictions at the lower 1Gbps speeds. Next, the cards were forced down to run at 1Gbps by inserting a fiber to copper transceiver with a CAT 6a cable connecting between them. The test was run again and as expected, the Solarflare cards nearly maxed out the bandwidth capabilities hitting 990 Mbps. This was to be our baseline of comparison. In addition to throughput and CPU utilization, a series of ping tests were also conducted to check for any latency issues.
Over the next several hours, the system is shut down, a new card inserted, rebooted, drivers and setting verified and finally the three primary tests conducted. In each test, one machine contains the test card while the other system continues to use the 10GbE Solarflare card. During the tests, the stock drivers and default MTU are used. The only significant change between tests is the number of iPerf streams used during the test. As it turned out, the number of streams made a big difference for some cards and virtually no difference for other cards. The throughput and CPU usage in the test results are given for the peak throughput obtained after testing at 1, 2, 4, 6, 8 & 10 parallel data streams. The following tables show a summary of our test results:
Test Results
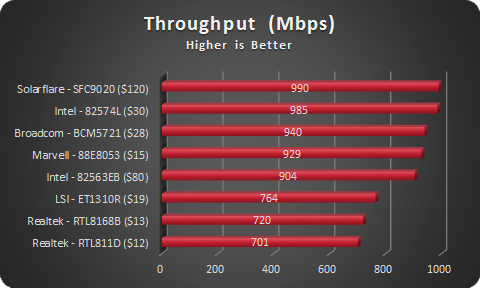
Sorted By highest to lowest
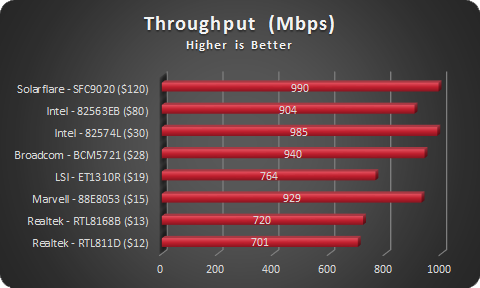
Sorted by Most Expensive to Least Expensive
Sorted by Lowest to Highest
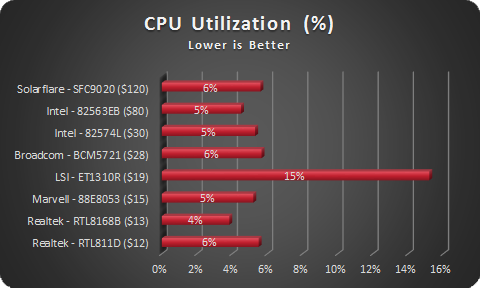
Sorted by Most Expensive to Least Expensive
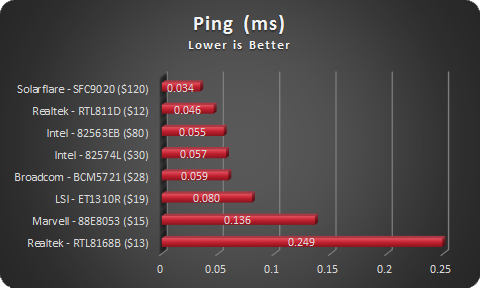
Sorted by Lowest to Highest
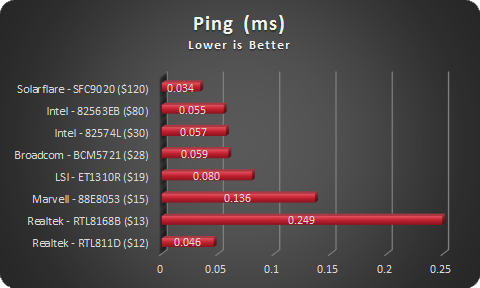
Sorted by Most Expensive to Least Expensive
While conducting out tests, there were some oddities that were noticed. As was previously mentioned, some cards did not handle parallel data streams equally well. This was expected to some extent; but, we were not expecting the extreme amount of variance that we saw. Some cards showed severe variances with throughput dropping below half of peak, while others were only minimally affected. The other anomaly that we observed was a ramp in of throughput. Each throughput test was conducted for 20 seconds. Some of the cards obtained peak throughput immediately while others slowly increased their throughput as the test duration extended. The following is a summary of our testing notes:
|
Testing Notes: |
||
|
Intel - 82563EB |
|
|
|
Realtek - RTL811D |
|
|
|
Realtek - RTL8168B |
|
|
|
Marvell - 88E8053 |
|
|
|
LSI - ET1310R |
|
|
|
Broadcom - BCM5721 |
|
|
|
Intel - 82574L |
|
|
|
Solarflare – SFC9020 |
|
|
|
VIA – VT6130 |
|
|
Wrap-up
It was unfortunate that the VIA card was unable to be tested. After we had finished testing we discovered that other people who purchased this card have also complained of thermal issues and it’s possible that this was the card's demise. The chip had no heat sink and this might have made all the difference to get it running properly. The high CPU usage on the LSI card was also odd, but consistent every time we re-ran the test. As for an overall evaluation of each cards performance, it would be unfair to give a combined overall score since that means assigning a weighted value to each category. However, on a whole, it appeared that the higher cost cards did seem to in general perform more admirably.
Keep in mind that these were out of the box performance measures. We wanted to show what the average person could expect should they just plug the card in and start using it. There are plenty of network tweaks that can be done to optimize performance and these numbers may very well have come out different had a different OS been used. As the saying goes “Your mileage may vary.” Furthermore, we were not interested in finding out so much if Brand A is better than Brand B. The goal was to see if there would be a variance in performance even though they operated within the same network standards, and if there was a variance, was it tied in any way to cost. To that end, the test were successful to show that there are significant variances and that for the most part there was a correlation tied to cost.
Lead photo courtesy of Nixdorf
Other NIC photos obtained from their respective company web pages
